|
Introduction
Model Structure
Categories
Procedures
Results
Figures & Tables
Introduction
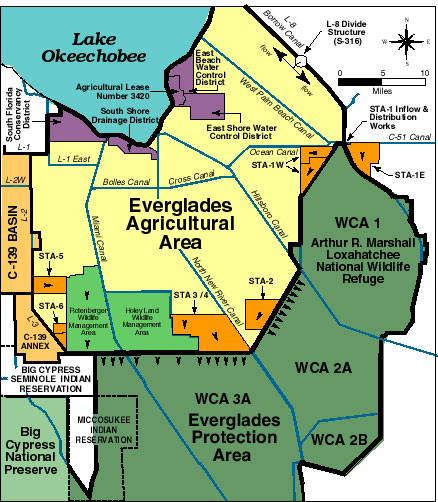
This report describes calibration and testing of the DMSTA Version 2 (2005) phosphorus cycling model using data from full-scale STA's, wetland treatment areas, lakes/reservoirs, and natural wetlands. DMSTA Version 1 (2002) calibrations were based primarily on data from small-scale experimental platforms operated for short periods, constant depths, and steady inflows (mesocosms, test cells). While data from the 3800-acre Everglades Nutrient Removal Project were also used extensively, this system was operated with relatively steady inflows and depths that were not representative of full-scale STA operation. The database to support model calibration has improved considerably since 2002 with operation and monitoring full-scale STA's (1W, 2, 5, and 6) and compilation of historical data from Florida lakes and reservoirs. Calibration to full-scale systems with dynamic inflows and depths provides an improved basis for designing future STA's and/or optimizing the existing ones. DMSTA2's reservoir components and calibrations allow simulation of regional water management strategies involving networks of storage reservoirs and treatment areas. Calibration datasets are summarized in the attached table. Some of the STA calibration datasets are limited by short duration and effects of startup/stabilization. The model is not designed to simulate this period. Trends in model residuals (observed - predicted outflow concentrations) provide indications of stabilization. Stabilization periods appear to be on the order of one to three (or more) years, depending on antecedent soils, operation, and other unknown site-specific factors. Model calibrations are based upon data collected after stabilization. Another limitation is that monitoring systems are still being refined (e.g., calibration of flow & stage recorders, installation of auto-samplers). The database to support calibration will continue to improve in the future with continued full-scale operation and monitoring. PSTA calibrations are still based primarily upon experimental data from test cells (STA-1W, STA-2). See discussion of PSTA technology & data limitations. The calibration basis is expected to improve in the future with data from full-scale PSTA test facilities in STA-34 and STA-1E. DMSTA2's P cycling model has been enhanced to include a factors accounting for saturation of uptake rates at high concentrations (C2 parameter) and for deterioration of vegetation & performance at high water depths (Z2, Z3 parameters). As described below, calibration involves fitting a K value to each dataset (least squares) with other model parameters held fixed (C0 = 3 ppb, C1 = 22 ppb, C2 = 300 ppb). The differences between flow-weighted and geometric means generated by DMSTA1 calibrations were generally greater than observed differences in systems with dynamic flows. This situation has been improved somewhat by reducing the C0 value from 4 to 3 ppb. This change also reduced variance in calibrated K values across datasets. With these changes, the model still tends to over-predict responses to pulse loading events at low P concentrations in some datasets (e.g. STA-2). Future enhancements to the model structure may be needed to improve these simulations. The steady-state storage vs. concentration relationship (dependent on C0, C1, and C2) is consistent with observed data. Calibration & Testing Procedures DMSTA Version 1 calibrations were based upon a single prototype dataset for each vegetation category (Emergent, SAV, PSTA). Each prototype was selected based upon a variety of factors, including vegetation characteristics, surface area, duration of dataset, and monitoring intensity. The remaining datasets in each category were utilized for testing prototype calibrations. DMSTA2 is calibrated for 5 categories (Emergent, SAV, PSTA, Pre-Existing Wetland, & Reservoir). These categories are defined below. Each of the current full-scale datasets has strengths and limitations. It is difficult to identify a single dataset as the "best" prototype in each vegetation category. Accordingly, the following alternative procedure has been followed in DMSTA2 calibration and testing:
The ranges of calibrated K values in each category are shown in the attached figure. Category definitions and results are summarized below:
A "_3" trailer is attached to each calibration name to distinguish it from previous DMSTA calibrations, which are no longer relevant or recommended for use in design. The attached table provides more detail on the calibration dataset ranges. Calcium requirements are relatively uncertain but should be considered in selecting calibrations for use in design. Calcium precipitation is known to be an important mechanism for phosphorus removal in SAV and PSTA systems. Calibrated K values are correlated with inflow calcium concentrations and calcium decreases (inflow-outflow) in the attached figure for STA cells and WCA-2A. K rates appear to be positively correlated with inflow calcium within each category. The relatively poor performance of STA-5 Cell 1B is consistent with its relatively low inflow calcium levels 67 ppm vs. 77-91 ppm for other SAV datasets. Calcium precipitation depends on temperature, pH, and the difference between calcium concentration and its saturation level (about 40 ppm). The distinction between STA-5 Cell 1 and the other SAV systems is more stronger when the saturation level is subtracted (27 vs. 37-61 ppm). STA-5 performance may be influenced by other factors, such as high inflow concentration, vegetation management difficulties, and short duration. Time series indicate that the Cell1B calibration may not have stabilized. Calcium may also play a role in reservoirs. Lake Okeechobee experienced a decline in net settling rate from ~ 4 m/yr to ~1 m/yr as load reduction decreased from 70 to 40 % between 1975 and 1999 (Walker, 2000). This decline is possibly related to loss of littoral zone, decrease in calcium content, increasing depths, and/or gradual accumulation of phosphorus in the pelagic sediments Regional variations in calcium are summarized in the attached figure. All of the other reservoir datasets are from north of the Lake, where calcium levels tend to be much lower, as compared with the EAA and other regions south of the Lake. Therefore, the reservoir calibrations are less likely to be calcium-dependent. Similarly, the emergent calibration includes two data datasets north of the Lake (Iron Bridge & Boney Marsh) which have K values similar to the other emergent datasets. Future analysis should be based upon additional calcium data for the reservoirs and other emergent datasets and computation of flow-weighted means. The above category definitions and constraints must be carefully considered in selecting a calibration for use in design. While exceeding calibration ranges does not necessarily invalidate results, DMSTA2 is a highly aggregated model and risk of error may increase significantly in such situations. If calibration ranges are exceeded, the user must exercise professional judgment as to whether or not the simulation results are reliable. This requires a thorough understanding of model calibration results and their limitations. Calibration ranges and correlations between cell properties and model error are depicted in residuals plots. It may be appropriate to use conservative parameter estimates (see Uncertainty Analysis below) when calibration ranges are exceeded. The reservoir calibration datasets did not include systems with highly fluctuating water depths, frequent dry-out, or bottom outlets. Model applications to such systems may require considerable extrapolation of the calibrations. Sensitivity analysis is recommended in design applications.
06/30/2005 |
|||||||||||||||||||||||||||||||||||||||||||||||||||||||||||||||||||||||||||||||||||||||||||||||||||||||||||||||||||||||||||||||||||||||||||||||||||||||||||||||||||||||||||||||||||||||||||||||||||||||||||||||||||||||||||||||||||||||||||||||||||||||||||||||||||||||||||||||||||||||||||||||||||||||||||||||||||||||||||||||||||||||||||||||||||||||||||||||||||||||||||||||||||||||||||||||||||||||||||||||||||||||||||||||||||||||||||||||||||||||||||||||||||||||||||||||||||||||||||||||||||||||||||||||||||||||||||||||||||||||||||||||||||||||||||||||||||||||||||||||||||||||||||||||||||||||||||||||||||||||||||||||||||||||