| DMSTA2 Phosphorus Cycling Model |
|
|
|
|
|
06/22/05 |
|
|
|
|
|
|
|
|
|
|
|
| One CSTR at
Steady-State |
|
|
|
|
|
|
|
|
| Unit Area
Storage & Fluxes |
|
|
|
|
|
|
|
|
| Concs in mg/m3 |
|
|
|
|
|
|
|
|
|
| Fluxes in mg/m2-yr |
|
|
|
|
|
|
|
|
|
| Storage in
mg/m2 |
|
Water
Column |
|
|
|
|
|
|

|
L |
Mass = M |

|
|
|
|
|
|
|
|
Conc = C =
M / Z |
|
|
|
|
|
|
|
|
|
|
|
|
|
|
|
|
|
|
|

|

|
|
|
|
|
|
|
|
|
FC FZ K1 S C |
|
K2 S2 |
|
|
|
|
|
|
|
|
|
|
|
|
|
|
|
|
| FZ = Depth Multiplier |
|
|
|
|
|
|
|
|
|
| FC = Conc Multiplier |
|
Biomass P Storage |
|
|
|
|
|
|
|
|
S |
|
|
|
|
|
|
|
|
|
|
|
|
|
|
|
|
|
|
|
|

|
|
|
|
|
|
|
|
|
|
|
|
K3 S |
|
|
|
|
|
|
|
|
|
|
|
|
|
|
|
|
| State
Variables: |
|
|
|
|
|
|
|
|
|
|
M |
Water Column P
Storage |
mg/m2 |
|
|
|
|
|
|
S |
Temporary
P Storage in Biota, etc. |
mg/m2 |
|
|
|
|
|
|
Z |
Water Column Mean Depth |
m |
|
|
|
|
|
|
|
|
|
|
|
|
|
|
|
|
| Driving
Variables: |
|
|
|
|
|
|
|
|
|
|
L |
P Load, Including Atmos. Deposition |
mg/m2-yr |
|
|
|
|
|
|
Q |
Outflow |
|
|
m/yr |
|
|
|
|
|
|
|
|
|
|
|
|
|
|
|
|
| Parameter Values: |
|
|
|
|
|
|
|
|
|
|
K1 |
Maximum Uptake Rate |
|
m3 / mg - yr |
|
|
|
|
|
|
K2 |
Recycle Rate |
|
m2 / mg-yr |
|
|
|
|
|
|
K3 |
Burial Rate |
|
|
1/yr |
|
|
|
|
|
|
|
|
|
|
|
|
|
|
|
|
| Steady-State
Mass Balances 1 CSTR, FZ = 1, & C
<< C2: |
|
|
|
|
|
|
Storage: |
|
K1 C
= K2 S + K3 |
|
|
|
|
|
|
Overall: |
|
L -
Q C = K3 S |
|
|
|
|
|
|
|
Solution for C: |
C =
( K2 L + K32 ) / (
K3 K1 +
Q K2 ) |
|
|
|
|
Solution for S: |
S =
( K1 C
- K3 )
/ K2 |
|
|
|
|
|
|
|
|
|
|
|
|
|
|
|
|
| For
Parameter-Estimation Purposes, Model Coefficients Are Re-expressed as
Follows: |
|
|
|
|
|
|
|
|
|
|
|
|
|
|
|
K |
Net Settling Rate at Steady State |
m/yr |
Fit to Concentration Time Series Data |
|
|
C0 |
Water Column Conc at S = 0 mg/m2 |
ppb |
Estimated from Storage
vs. Conc Relationship |
|
|
C1 |
Water Column Conc at S = 1000 mg/m2 |
ppb |
Fit to Concentration Time Series Data |
|
|
|
|
|
|
|
|
|
|
|
|
|
Steady-State
Solution: |
|
|
|
|
|
|
|
|
|
|
C =
( L +
K C0
) /
( K + Q
) |
|
|
|
|
|
|
|
S =
1000 ( C
- C0 ) /
( C1 -
C0 ) |
used to
calibrate C0 & C1 |
|
|
|
|
|
|
|
|
|
|
|
|
|
|
The
steady-state solution is equivalent to the familiar K/C* model with C* = C0 : |
|
|
|
|
|
|
|
|
|
|
|
|
|
|
|
|

|
C |

|
|
|
|
|
|
|
|
|
|
|
|
|
|
|
|
|
|
|
|

|
|
|
|
|
|
|
|
|
|
|
K ( C
- C0 ) |
|
|
|
|
|
|
where, |
|
|
|
|
|
|
|
|
|
|
|
K = K2
K1 / K2 |
|
|
|
|
|
|
|
|
|
|
|
|
|
|
|
|
|
|
|
Translations
of Parameter Sets: |
|
|
|
|
|
|
|
|
|
K3 =
K ( C1
- C0 ) / 1000 |
K =
K1 K3 / K2 |
|
|
|
|
|
|
K1 = K3
/ C0 |
|
C0
= K3 / K1 |
|
|
|
|
|
|
K2
= K3 K1
/ K |
|
C1
= (1000 K2 + K3
) / K1 |
|
|
|
|
|
|
|
|
|
|
|
|
|
|
| Calibrations: |
|
|
|
|
|
|
|
|
|
|
EMERG |
emergent
marsh (cattail etc.) on previously farmed or otherwise disturbed soils |
|
|
|
PEW |
preexistent
wetlend; former wetland with vegetation established prior to construction;
calcitic waters |
|
SAV |
cell
managed for SAV or other favorable community; calcitic waters |
|
|
|
|
PSTA |
periphyton
treatment area (peat removed or capped) |
|
|
|
|
|
RESERV |
lake or reservoir,
generally depths > 150 cm |
|
|
|
|
|
|
|
|
|
|
|
|
|
|
|
|
|
Parameter |
|
|
|
|
EMG_3 |
PEW_3 |
SAV_3 |
PSTA_3 |
RES_3 |
|
C0 |
WC Conc at 0 g/m2 Storage |
ppb |
3 |
3 |
3 |
3 |
3 |
|
C1 |
WC Conc at 1 g/m2 Storage |
ppb |
22 |
22 |
22 |
22 |
150 |
|
C2 |
Half-Saturation Conc for P Uptake |
ppb |
300 |
300 |
300 |
300 |
0 |
|
K |
Net Settling Rate at Steady State |
m/yr |
16.8 |
34.9 |
52.5 |
23.6 |
5.0 |
|
Z1 |
Depth at Maximum Uptake |
cm |
40 |
40 |
40 |
0 |
40 |
|
Z2 |
Transition Depth |
|
cm |
100 |
100 |
100 |
100 |
100 |
|
Z3 |
Depth at Minimum Uptake |
cm |
200 |
200 |
200 |
200 |
400 |
|
FZ3 |
Relative Uptake Rate at Z >= Z3 |
- |
0.2 |
0.2 |
0.2 |
0.2 |
0.2 |
|
|
|
|
|
|
|
|
|
|
|
|
K1 |
Uptake Rate |
|
m3 / mg-yr |
0.1064 |
0.2210 |
0.3325 |
0.1495 |
0.2450 |
|
K2 |
Recycle Rate |
|
m2 / mg-yr |
0.0020 |
0.0042 |
0.0063 |
0.0028 |
0.0360 |
|
K3 |
Burial Rate |
|
|
1/yr |
0.3192 |
0.6631 |
0.9975 |
0.4484 |
0.7350 |
|
|
|
|
|
|
|
|
|
|
|
| Depth Effects: |
|
|
|
|
|
|
|
|
|
|
Parameters
inferred from STA operating experience & calibrations |
|
|
|
|
|
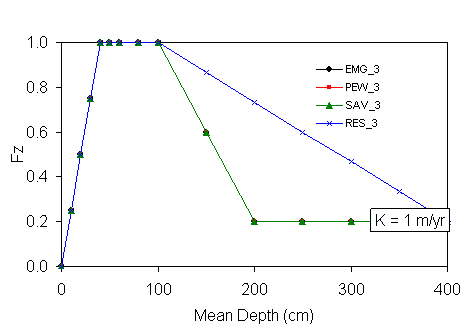
Performance
increases between 0 and Z1
(topographic effects, effective treatment area, short-circuiting) |
|
|
Marsh
performance starts to deteriorate at 30-day mean depth > Z2 (uprooting,
light-limitation, short-circuiting, etc.) |
|
Reservoir
performance starts to deteriorate at depths > Z2 (stratification/anoxia,
turbulence, light limitation) |
|
|
Between
Z2 and Z3 all calibrations converge to effective K = 1 m/yr (K1, K2, K3
adjusted accordingly) |
|
|
These
transitions are ignored if input Z1-Z3 values = 0 |
|
|
|
|
|
|
STA's
typically operated at static depth of 40 cm, & 40- 80 cm during inflow events |
|
|
|
|
|
|
|
|
|
|
|
|
|
|
|
Z1 |
Saturated Uptake Depth |
daily |
cm |
|
|
|
|
|
|
Z2 |
Lower Penalty Depth |
30-day |
cm |
|
|
|
|
|
|
Z3 |
Upper Penalty Depth |
30-day |
cm |
|
|
|
|
|
|
|
|
|
|
|
|
|
|
|
|
|
|
|
|
|
|
|
|
|
|
|
|
|
|
|
|
|
|
|
|
|
|
|
|
|
|
|
|
|
|
|
|
|
|
|
|
|
|
|
|
|
|
|
|
|
|
|
|
|
|
|
|
|
|
|
|
|
|
|
|
|
|
|
|
|
|
|
|
|
|
|
|
|
|
|
|
|
|
|
|
|
|
|
|
|
|
|
|
|
|
|
|
|
|
|
|
|
|
|
|
|
|
|
|
|
|
|
|
|
|
|
|
|
|
|
|
|
|
|
|
|
|
|
|
|
|
|
|
|
|
|
|
|
|
|
|
|
|
|
|
|
|
|
|
|
|
|
|
|
|
|
|
|
|
|
|
|
|
|
|
|
|
|
|
|
|
|
|
|
|
|
|
|
|
|
|
|
|
|
|
|
|
|
|
|
|
|
|
|
|
|
|
|
|
|
|
|
|
|
|
|
|
|
|
|
|
|
|
|
|
|
|
|
|
|
|
|
|
|
|
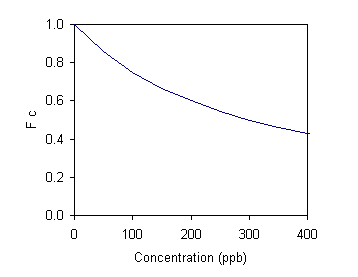
| Concentration
Multiplier for Gross Uptake Rate: |
|
|
|
|
|
|
|
Reflects saturation of uptake rate at high
concentrations |
|
|
|
|
|
|
FC = C2 / ( C
+ C2 ) |
|
|
|
|
|
|
|
|
|
C2
= half-sat. conc for P uptake = |
300 |
ppb |
|
|
|
|
|
|
Calibrated to marsh
datasets in high conc range |
|
|
|
|
|
|
|
Not applied
to reservoirs. |
|
|
|
|
|
|
|
|
Conc |
|
|
|
|
|
|
|
|
|
|
ppb |
FC |
|
|
|
|
|
|
|
|
|
0 |
1.00 |
|
|
|
|
|
|
|
|
|
50 |
0.86 |
|
|
|
|
|
|
|
|
|
100 |
0.75 |
|
|
|
|
|
|
|
|
|
150 |
0.67 |
|
|
|
|
|
|
|
|
|
200 |
0.60 |
|
|
|
|
|
|
|
|
|
250 |
0.55 |
|
|
|
|
|
|
|
|
|
300 |
0.50 |
|
|
|
|
|
|
|
|
|
350 |
0.46 |
|
|
|
|
|
|
|
|
|
400 |
0.43 |
|
|
|
|
|
|
|
|
|
450 |
0.40 |
|
|
|
|
|
|
|
|
|
500 |
0.38 |
|
|
|
|
|
|
|
|
|
|
|
|
|
|
|
|
|
|
|
|
|
|
|
|
|
|
|
|
|
|
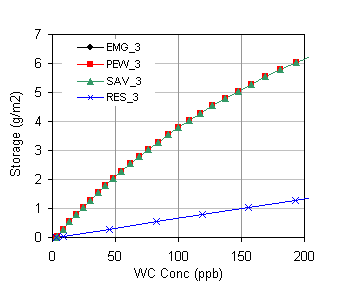
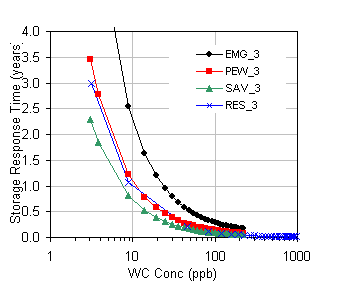
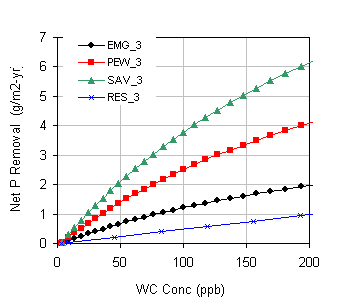
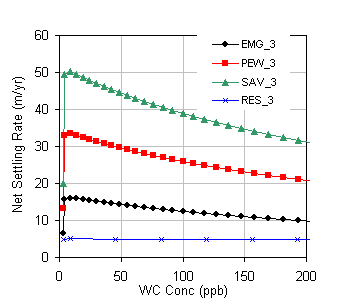
| Steady-State Solutions of P Cycling Model for Each
Calibration |
|
|
|
|
| Mean Depth = |
60 |
cm |
Hydraulic Load = |
10 |
m/yr |
|
|
|
|
|
|
|
|
|
|
|
|
|
|
| Storage (mg/m2) |
|
|
|
Storage
Response Time (yrs) |
|
|
|
|
|
|
|
|
|
|
|
|
|
|
|
|
|
|
|
|
|
|
|
|
|
|
|
|
|
|
|
|
|
|
|
|
|
|
|
|
|
|
|
|
|
|
|
|
|
|
|
|
|
|
|
|
|
|
|
|
|
|
|
|
|
|
|
|
|
|
|
|
|
|
|
|
|
|
|
|
|
|
|
|
|
|
|
|
|
|
|
|
|
|
|
|
|
|
|
|
|
|
|
|
|
|
|
|
|
|
|
|
|
|
|
|
|
|
|
|
|
|
|
|
|
|
|
|
|
|
|
|
|
|
|
|
|
|
|
|
|
|
|
|
|
|
|
|
|
|
|
|
|
|
|
|
|
|
|
|
|
|
|
|
|
|
|
|
|
|
|
|
|
|
|
|
|
|
|
|
|
|
|
|
|
|
|
|
|
|
|
|
|
|
|
|
|
|
|
|
| Net P Removal (g/m2-yr) |
|
|
|
Net Settling
Rate (m/yr) |
|
|
|
|
|
|
|
|
|
|
|
|
|
|
|
|
|
|
|
|
|
|
|
|
|
|
|
|
|
|
|
|
|
|
|
|
|
|
|
|
|
|
|
|
|
|
|
|
|
|
|
|
|
|
|
|
|
|
|
|
|
|
|
|
|
|
|
|
|
|
|
|
|
|
|
|
|
|
|
|
|
|
|
|
|
|
|
|
|
|
|
|
|
|
|
|
|
|
|
|
|
|
|
|
|
|
|
|
|
|
|
|
|
|
|
|
|
|
|
|
|
|
|
|
|
|
|
|
|
|
|
|
|
|
|
|
|
|
|
|
|
|
|
|
|
|
|
|
|
|
|
|
|
|
|
|
|
|
|
|
|
|
|
|
|
|
|
|
|
|
|
|
|
|
|
|
|
|
|
|
|
|
|
|
|
|
|
|
|
|
|
|
|
|
|
|
|
|
|
|
|
|
|
|
|
|
|
|
|
|
|
| 6/22/2005 |
|
|
|
|
|
|
|
|
|
|
|
|
|
|
|
|
|
|
|
|


