|
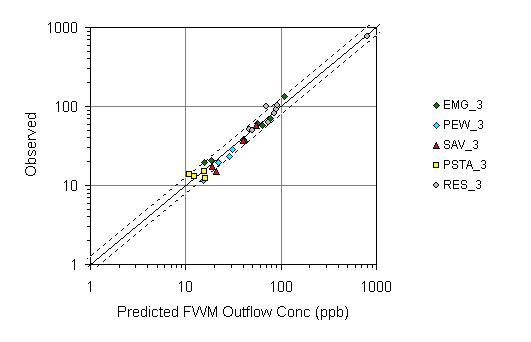
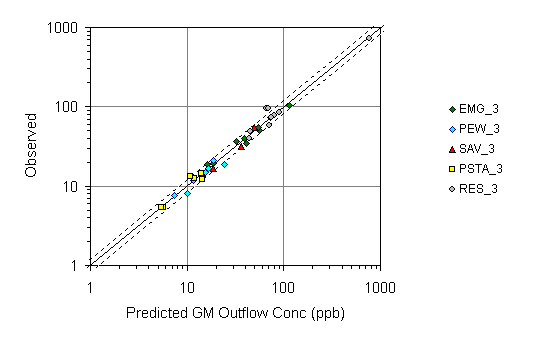
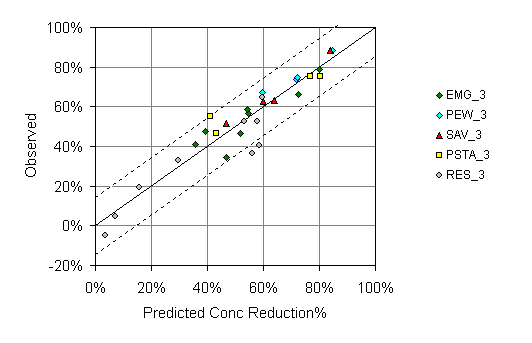
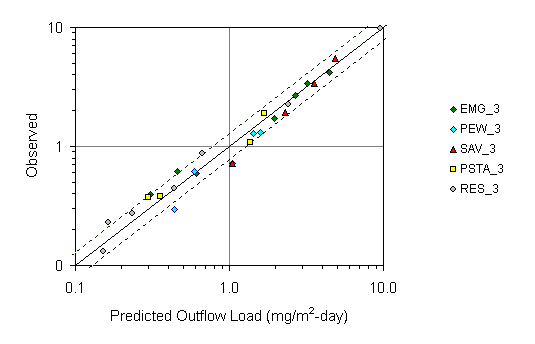
Observed vs. Predicted Values using Default Calibrations for Each Vegetation Category | 6/1/2005 | ||||||||||||||
| Residual Statistics | Parameter Values | |||||||||||||||
| Variable | R2 | SE% | 80% CL | Category | Count | K (m/yr) | CV (K) | C0 (ppb) | C1 (ppb) | C2 (ppb) | Z1 (cm) | Z2 (cm) | Z3 (cm) | |||
| Flow Wtd Conc | 0.97 | 18% | 23% | EMG_3 | 9 | 16.9 | 0.20 | 3 | 22 | 300 | 40 | 0 | 0 | |||
| Geo Mean Conc | 0.98 | 15% | 19% | PEW_3 | 7 | 34.9 | 0.21 | 3 | 22 | 300 | 40 | 0 | 0 | |||
| Load | 0.97 | 20% | 26% | SAV_3 | 4 | 52.5 | 0.16 | 3 | 22 | 300 | 40 | 0 | 0 | |||
| Conc Reduction | 0.77 | 11% | 14% | PSTA_3 | 6 | 23.6 | 0.22 | 3 | 22 | 300 | 0 | 0 | 0 | |||
| RES_3 | 9 | 5.0 | 0.45 | 3 | 150 | 0 | 40 | 100 | 400 | |||||||
| Dashed Lines = 80% Prediction Interval | CV(K) = coefficient of variation of calibrated K across datasets with each category | |||||||||||||||