|
STA & Reservoir Performance Measures for the Everglades RestudyResults for Alternative D13R03/30/02 |
|
STA & Reservoir Performance Measures for the Everglades RestudyResults for Alternative D13R03/30/02 |
|
|||||||||||||||||||||||||
| This page summarizes water and mass-balance results for
Alternative D and Calendar Years 1965-1995. Comparisons with the 2050 Base Run
are made where appropriate. Figures & Discussion:
|
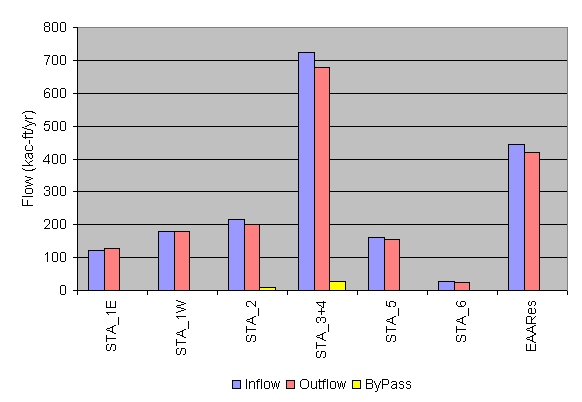
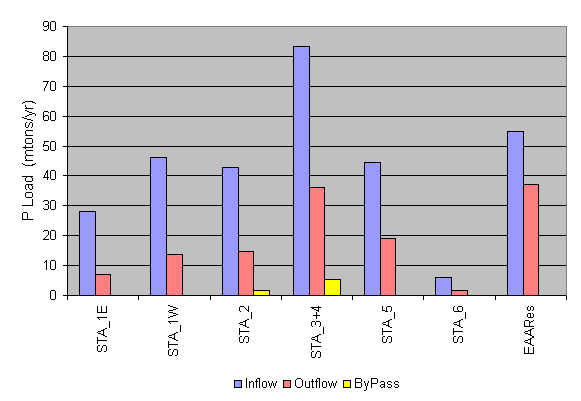
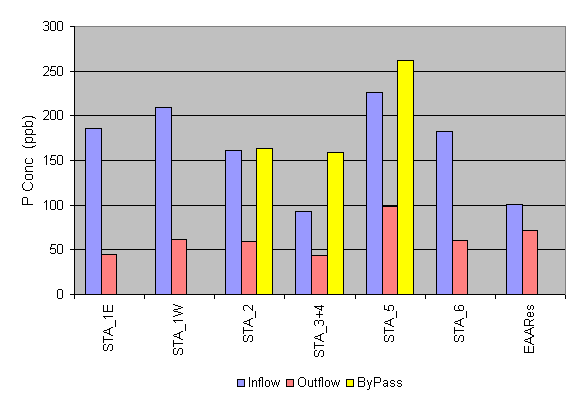
| STA Inflow, Outflow, & Bypass Flows, Alt-D13R, 1965-1995 |
|
|
|
| These charts show inflow, outflow, and high-flow bypass flows, loads, and concentrations for the1965-1995 period. Alternative D13R. |
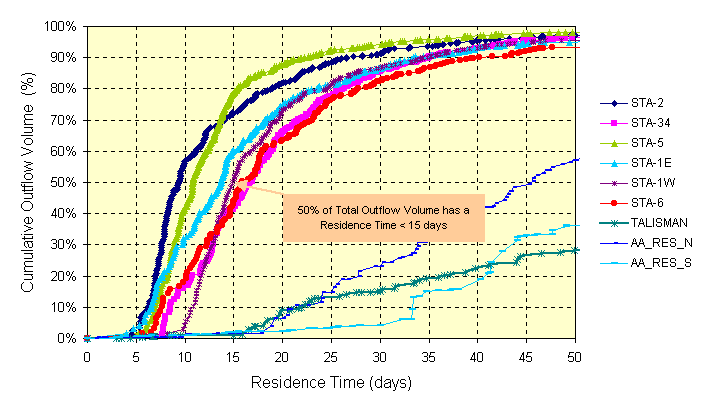
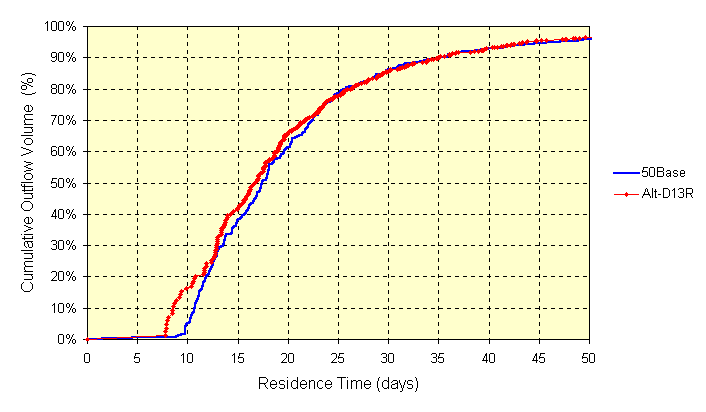
Residence Time Distributions, Alt-D13R |
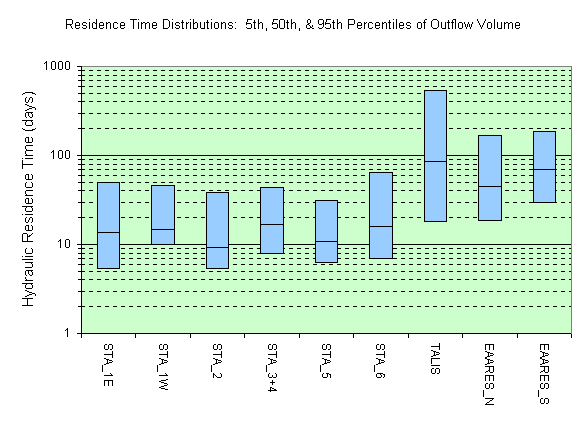 |
| This chart compares the frequency distributions of mean hydraulic residence times under 1965-1995 hydrologic conditions. HRT's are calculated monthly as mean pool volume / mean outflow rate. Frequency distributions are expressed as a percentages of the total outflow volume over the 1965-1995 period. Frequency distributions are represented by the 5th, 50th, and 95th percentiles. |
HRT Cumulative Frequency Distributions |
|
| These charts compare the cumulative frequency distributions of mean hydraulic residence times under 1965-1995 hydrologic conditions. HRT's are calculated monthly as mean pool volume / mean outflow rate. Frequency distributions are expressed as a percentages of the total outflow volume over the 1965-1995 period. An X,Y value represents the percent of total discharge volume (Y) with a residence time less than X days. |
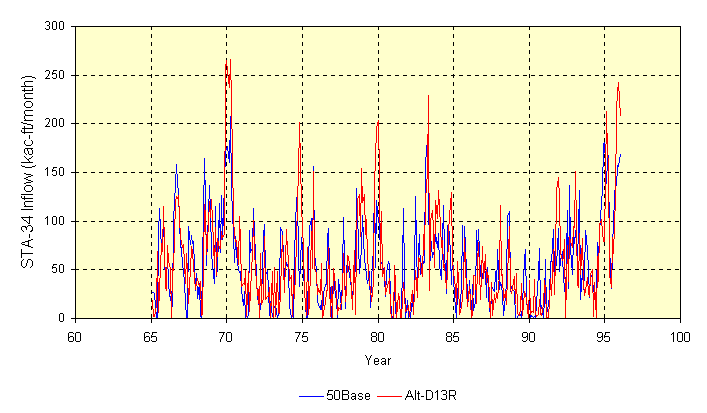
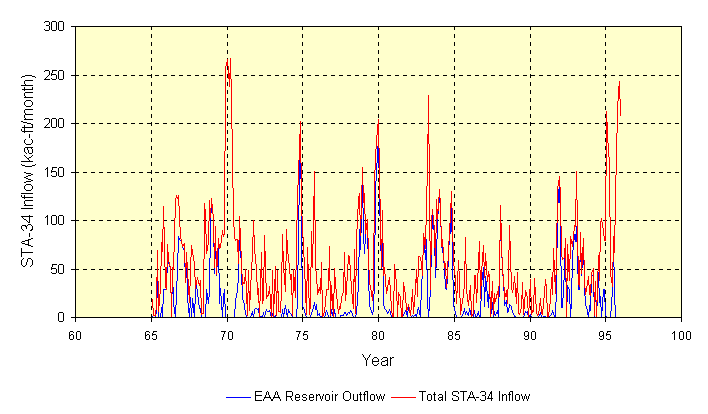
STA-34 Inflow Time Series |
|
|
| These charts show monthly inflows to STA-34. The upper chart shows total inflows for 50Base (without storage reservoir) and Alternative D13R (with storage reservoir). The lower chart shows the total STA-34 inflow and STA-34 inflows from the EAA reservoirs (WCS4N, WCS4S, EVBLS,EVBLN) for Alternative D13R. Reservoir outflows tend to increase peak hydraulic loads to STA-34. |
HRT Cumulative Frequency Distributions for STA-34 |
|
| This chart compares the cumulative frequency distributions of mean hydraulic residence times under 1965-1995 hydrologic conditions for STA-34. HRT's are calculated as monthly mean pool volume/ mean outflow rate. Frequency distributions are expressed as a percentages of the total outflow volume over the 1965-1995 period. An X,Y value represents the percent of total discharge volume (Y) with a residence time less than X days. Results for STA-34 without the EAA storage reservoir (50Base) and with the EAA storage reservoir (Alternative D13R) are compared. HRT's in STA-34 are lower with the storage reservoir in place. |
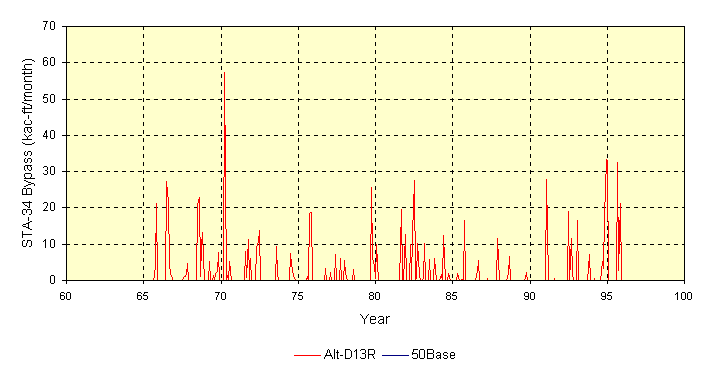
STA-34 Bypass |
|
| This chart shows monthly STA-34 bypass volumes for 50Base and Alternative D13R. No Bypass events are predicted for 50Base. It is evident that with Alternative D13R bypass events occur more often than the 1/10 year frequency assumed in STA design. |
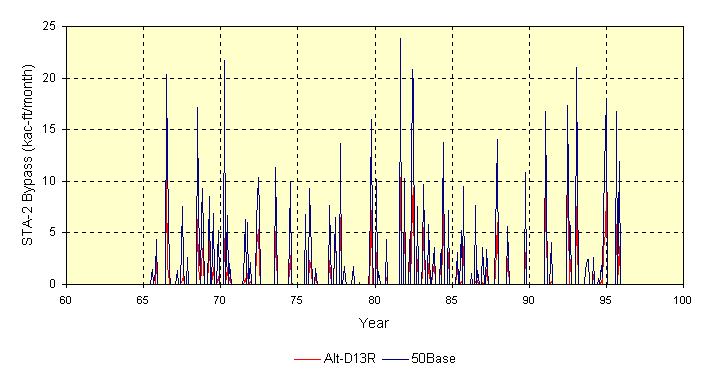
STA-2 Bypass |
|
| This chart shows monthly STA-2 bypass volumes for 50Base and Alternative D13R. It is evident that bypass events occur more often than the 1/10 year frequency assumed in STA design. Although event frequencies are similar for the two alternatives, peak and total bypass flows are lower for ALT-D13R. STA-2 bypasses will be discharged to Northwest WCA-2A in the same areas receiving outflows from the treatment system. |
STA & Reservoir Performance Measures
http://www.shore.net/~wwwalker/restudy/altd.htm Updated: 03/30/02