| DMSTA Simulation Results |
|
Case: |
Design_C |
|
Period: |
1/1/1965 |
to |
12/31/1995 |
|
|
|
|
|
| |
|
|
|
|
|
|
|
|
|
|
|
|
|
|
|
| Case: |
EAA Reservoir C - SFWMD Basin
Spec Feas Study 2002 |
|
|
|
|
| |
|
|
|
|
| |
|
|
|
|
| |
|
|
|
|
|
|
|
|
|
|
|
|
|
|
|
| Input Series |
|
design_C |
|
|
Tanks in Series |
|
1.0 |
Surface Area (km2) |
51.8263 |
|
|
|
|
|
| Simulation Period |
01/04/55 |
thru |
12/31/95 |
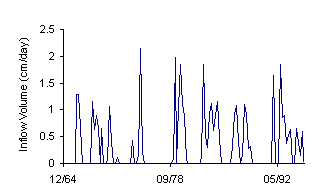
Mean Water
Load (cm/d) |
0.7 |
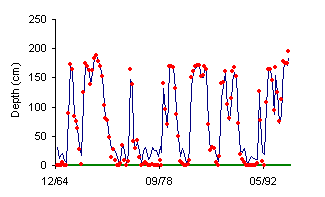
Mean Depth (cm) |
80 |
|
|
|
|
|
| Output Period |
|
01/01/65 |
thru |
12/31/95 |
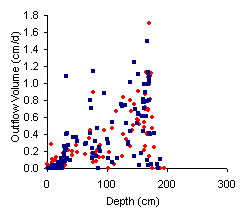
Max Water Load
(cm/d) |
4.7 |
Max Depth (cm) |
|
207 |
|
|
|
|
|
| Calib Period |
|
01/01/65 |
|
12/31/95 |
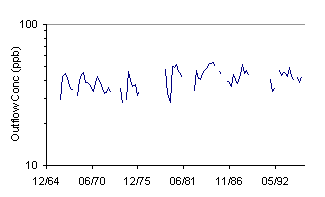
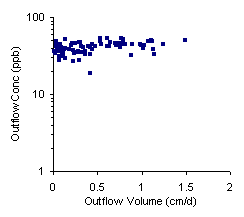
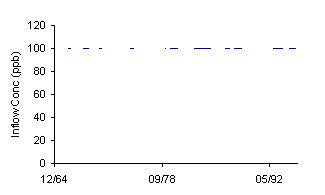
Inflow Conc (ppb) |
100.0 |
Freq Depth
< 5 cm |
4.0% |
|
|
|
|
|
| Startup Interval (days) |
3650 |
Iterations |
-10 |
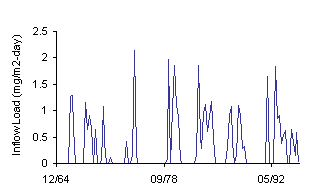
Inflow P Load
(mg/m2-yr) |
119 |
Load Reduction |
|
58% |
|
|
|
|
|
| Avg Interval (days) |
90 |
Wtr Bal Error |
0.0% |
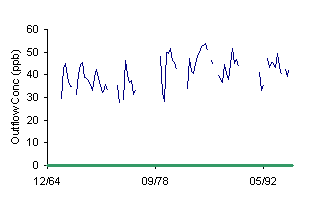
Outflow
FWM Conc (ppb) |
42.5 |
Conc Reduction |
|
57% |
|
|
|
|
|
| Parameter Set: |
|
RESERV |
Mass B Error |
-0.2% |
Outflow C with Bypass |
42.5 |
Time Freq
Conc > 10 ppb |
28% |
|
|
|
|
|
| K (m/yr) |
|
3.200 |
Kd (m/yr) |
0 |
95th Percentile
(ppb) |
51.1 |
K - SS, C*=4
ppb (m/yr) |
2.8 |
|
|
|
|
|
| C1
(ppb) |
|
150.0 |
Weir Depth (cm) |
30 |
Outflow Geo.
Mean (ppb) |
55.4 |
Storage Turnover (1/yr) |
4.5 |
|
|
|
|
|
| C0 (ppb) |
|
4.0 |
Cont Depth (cm) |
0 |
Outflow
GM, Q>0 (ppb) |
38.4 |
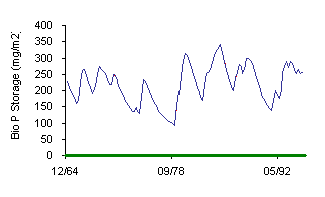
Mean Stored P (mg/m2) |
219 |
|
|
|
|
|
| C2 (ppb) |
|
0 |
Qout Intercept |
5.0 |
Seepage Loss |
|
0% |
Storage Inc/Net
Removal |
0% |
|
|
|
|
|
| Zx (cm) |
|
40 |
Qout Exponent |
1.5 |
HRT (days) |
|
246.4 |
Outfl. Seepage
(cm/d/cm) |
0 |
|
|
|
|
|
| |
|
|
|
|
|
|
|
|
|
|
|
|
|
|
|
| Ki |
E/m2-d |
0 |
0 |
Model 2 |
Mean Biomass (g/m2) |
#N/A |
Biomass Turnover (1/yr) |
#N/A |
|
|
|
|
|
| Kb |
1/d |
0 |
0 |
" |
Gross PP
(g/m2-d) |
#N/A |
Total Resp (g/m2-d) |
#N/A |
|
|
|
|
|
| Kr |
1/d/g/m2 |
0 |
0 |
" |
|
|
|
|
|
|
|
|
|
|
|
| Ka |
1/d |
0 |
0 |
" |
|
|
|
|
|
|
|
|
|
|
|
| Kc |
ppb |
0 |
0 |
" |
|
|
|
|
|
|
|
|
|
|
|
| Ke |
1/d |
0 |
0 |
" |
|
|
|
|
|
|
|
|
|
|
|
| Ku |
mg/m2 |
0 |
0 |
" |
|
|
|
|
|
|
|
|
|
|
|
| |
|
|
|
|
|
|
|
|
|
|
|
|
|
|
|
| Calibration Statistics for Period: |
|
01/01/65 |
thru |
12/31/95 |
|
|
|
|
|
|
|
|
|
|
| |
|
|
|
|
|
Mean |
Mean |
|
|
|
|
|
|
|
|
| Inflow P Conc
(ppb) = |
100 |
Count |
Observed |
Predicted |
Residual |
Resid% |
RSE% |
R2 |
|
|
|
|
|
|
| Mean Depth (cm) |
|
125 |
76.1 |
79.5 |
-3.4 |
-4% |
15% |
97% |
|
|
|
|
|
|
| Flow (cm/day) |
|
|
125 |
0.27 |
0.32 |
-0.05 |
-14% |
68% |
70% |
|
|
|
|
|
|
| Flow-Wtd-Mean
Conc (ppb) |
|
0 |
#N/A |
#N/A |
#N/A |
#N/A |
|
|
|
|
|
|
|
|
| Geometric Mean Conc (ppb) |
|
0 |
#N/A |
#N/A |
#N/A |
#N/A |
#N/A |
#N/A |
|
|
|
|
|
|
| Mean Conc (ppb) |
|
0 |
#N/A |
40.6 |
#N/A |
#N/A |
#N/A |
#N/A |
|
|
|
|
|
|
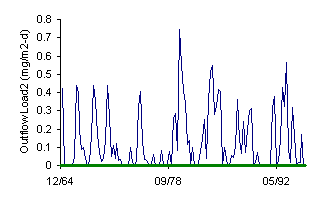
| Outflow Load (mg/m2-d) |
|
0 |
#N/A |
#N/A |
#N/A |
#N/A |
#N/A |
#N/A |
|
|
|
|
|
|
| Pred Q x Conc
(mg/m2-d) |
|
0 |
#N/A |
#N/A |
#N/A |
#N/A |
#N/A |
#N/A |
|
|
|
|
|
|
| Conc Reduction (%) |
|
0 |
#N/A |
#N/A |
#N/A |
#N/A |
|
|
|
|
|
|
|
|
|
|
|
|
|
|
|
|
|
|
|
|
|
|
|
|
| |
|
|
|
|
|
|
|
|
|
|
|
|
|
|
|
| |
|
|
|
|
|
|
|
|
|
|
|
|
|
|
|
| |
|
|
|
|
|
|
|
|
|
|
|
|
|
|
|
| |
|
|
|
|
|
|
|
|
|
|
|
|
|
|
|
| |
|
|
|
|
|
|
|
|
|
|
|
|
|
|
|
| |
|
|
|
|
|
|
|
|
|
|
|
|
|
|
|
| |
|
|
|
|
|
|
|
|
|
|
|
|
|
|
|
| |
|
|
|
|
|
|
|
|
|
|
|
|
|
|
|
| |
|
|
|
|
|
|
|
|
|
|
|
|
|
|
|
| |
|
|
|
|
|
|
|
|
|
|
|
|
|
|
|
| |
|
|
|
|
|
|
|
|
|
|
|
|
|
|
|
| |
|
|
|
|
|
|
|
|
|
|
|
|
|
|
|
| |
|
|
|
|
|
|
|
|
|
|
|
|
|
|
|
| |
|
|
|
|
|
|
|
|
|
|
|
|
|
|
|
| |
|
|
|
|
|
|
|
|
|
|
|
|
|
|
|
| |
|
|
|
|
|
|
|
|
|
|
|
|
|
|
|
| |
|
|
|
|
|
|
|
|
|
|
|
|
|
|
|
| |
|
|
|
|
|
|
|
|
|
|
|
|
|
|
|
| |
|
|
|
|
|
|
|
|
|
|
|
|
|
|
|
| |
|
|
|
|
|
|
|
|
|
|
|
|
|
|
|
| |
|
|
|
|
|
|
|
|
|
|
|
|
|
|
|
|
|
|
|
|
|
|
|
|
|
|
|
|
|
|
|
|
| |
|
|
|
|
|
|
|
|
|
|
|
|
|
|
|
| |
|
|
|
|
|
|
|
|
|
|
|
|
|
|
|
| |
|
|
|
|
|
|
|
|
|
|
|
|
|
|
|
| |
|
|
|
|
|
|
|
|
|
|
|
|
|
|
|
| |
|
|
|
|
|
|
|
|
|
|
|
|
|
|
|
| |
|
|
|
|
|
|
|
|
|
|
|
|
|
|
|
| |
|
|
|
|
|
|
|
|
|
|
|
|
|
|
|
| |
|
|
|
|
|
|
|
|
|
|
|
|
|
|
|
| |
|
|
|
|
|
|
|
|
|
|
|
|
|
|
|
| |
|
|
|
|
|
|
|
|
|
|
|
|
|
|
|
| |
|
|
|
|
|
|
|
|
|
|
|
|
|
|
|
| |
|
|
|
|
|
|
|
|
|
|
|
|
|
|
|
| |
|
|
|
|
|
|
|
|
|
|
|
|
|
|
|
| |
|
|
|
|
|
|
|
|
|
|
|
|
|
|
|
| |
|
|
|
|
|
|
|
|
|
|
|
|
|
|
|
| |
|
|
|
|
|
|
|
|
|
|
|
|
|
|
|
| |
|
|
|
|
|
|
|
|
|
|
|
|
|
|
|
| |
|
|
|
|
|
|
|
|
|
|
|
|
|
|
|
| |
|
|
|
|
|
|
|
|
|
|
|
|
|
|
|
| |
|
|
|
|
|
|
|
|
|
|
|
|
|
|
|
| |
|
|
|
|
|
|
|
|
|
|
|
|
|
|
|
| |
|
|
|
|
|
|
|
|
|
|
|
|
|
|
|
| |
|
|
|
|
|
|
|
|
|
|
|
|
|
|
|
| |
|
|
|
|
|
|
|
|
|
|
|
|
|
|
|
| |
|
|
|
|
|
|
|
|
|
|
|
|
|
|
|
| |
|
|
|
|
|
|
|
|
|
|
|
|
|
|
|
| |
|
|
|
|
|
|
|
|
|
|
|
|
|
|
|
| |
|
|
|
|
|
|
|
|
|
|
|
|
|
|
|
| |
|
|
|
|
|
|
|
|
|
|
|
|
|
|
|
| |
|
|
|
|
|
|
|
|
|
|
|
|
|
|
|
| |
|
|
|
|
|
|
|
|
|
|
|
|
|
|
|
| |
|
|
|
|
|
|
|
|
|
|
|
|
|
|
|
| |
|
|
|
|
|
|
|
|
|
|
|
|
|
|
|
| |
|
|
|
|
|
|
|
|
|
|
|
|
|
|
|
| |
|
|
|
|
|
|
|
|
|
|
|
|
|
|
|
| |
|
|
|
|
|
|
|
|
|
|
|
|
|
|
|
| |
|
|
|
|
|
|
|
|
|
|
|
|
|
|
|
| |
|
|
|
|
|
|
|
|
|
|
|
|
|
|
|
| |
|
|
|
|
|
|
|
|
|
|
|
|
|
|
|
| |
|
|
|
|
|
|
|
|
|
|
|
|
|
|
|
| |
|
|
|
|
|
|
|
|
|
|
|
|
|
|
|
| |
|
|
|
|
|
|
|
|
|
|
|
|
|
|
|
| |
|
|
|
|
|
|
|
|
|
|
|
|
|
|
|
| |
|
|
|
|
|
|
|
|
|
|
|
|
|
|
|
| |
|
|
|
|
|
|
|
|
|
|
|
|
|
|
|
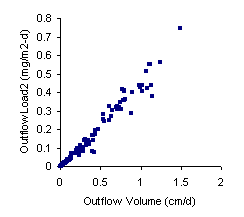
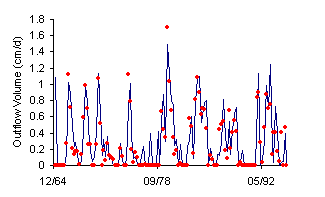
| Obs Load2 = Predicted
Flow x Observed Conc |
|
|
|
|
|
|
|
|
|
|
|
|
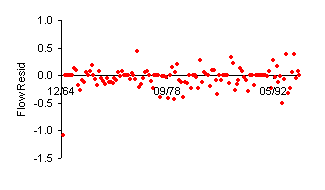
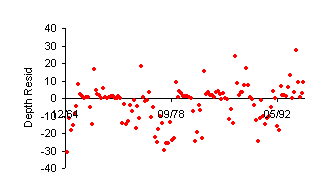
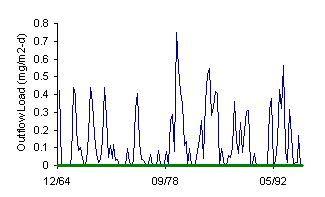
| Green
lines on x axis of concentration plots indicate model calibration
period. Statistics at top of sheet are
for entire output period. |
|
|
|
|
|
|
| 03/02/05 |
|
|
|
|
|
|
|
|
|
|
|
|
|
|
|
|
|
|
|
|
|
|
|
|
|
|
|
|
|
|
|