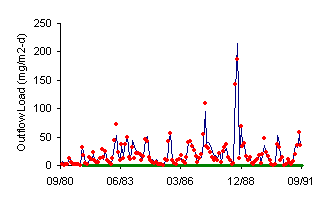
| DMSTA Simulation Results |
|
Case: |
THONOTO |
|
Period: |
10/1/1980 |
to |
9/30/1991 |
|
|
|
|
|
| |
|
|
|
|
|
|
|
|
|
|
|
|
|
|
|
| Case: |
Lake Thonotosassa; inflows not
gauged; inflow time series smoothed (14-day rolling average) to eliminate
negative inflows |
|
|
|
|
| |
|
|
|
|
| |
|
|
|
|
| |
|
|
|
|
|
|
|
|
|
|
|
|
|
|
|
| Input Series |
|
THONOTO_AVG |
|
|
Tanks in Series |
|
2.0 |
Surface Area (km2) |
3.3200 |
|
|
|
|
|
| Simulation Period |
10/03/75 |
thru |
09/30/91 |
Mean Water
Load (cm/d) |
3.1 |
Mean Depth (cm) |
152 |
|
|
|
|
|
| Output Period |
|
10/01/80 |
thru |
09/30/91 |
Max Water Load
(cm/d) |
45.0 |
Max Depth (cm) |
|
349 |
|
|
|
|
|
| Calib Period |
|
10/01/81 |
|
09/30/91 |
Inflow Conc (ppb) |
1095.6 |
Freq Depth
< 5 cm |
0.0% |
|
|
|
|
|
| Startup Interval (days) |
2190 |
Iterations |
-5 |
Inflow P Load
(mg/m2-yr) |
11249 |
Load Reduction |
|
34% |
|
|
|
|
|
| Avg Interval (days) |
30 |
Wtr Bal Error |
0.0% |
Outflow
FWM Conc (ppb) |
749.7 |
Conc Reduction |
|
32% |
|
|
|
|
|
| Parameter Set: |
|
none |
Mass B Error |
0.0% |
Outflow C with Bypass |
749.7 |
Time Freq
Conc > 10 ppb |
100% |
|
|
|
|
|
| K (m/yr) |
|
4.710 |
Kd (m/yr) |
0 |
95th Percentile
(ppb) |
1132.9 |
K - SS, C*=4
ppb (m/yr) |
4.6 |
|
|
|
|
|
| C1
(ppb) |
|
150.0 |
Weir Depth (cm) |
120 |
Outflow Geo.
Mean (ppb) |
710.3 |
Storage Turnover (1/yr) |
158.3 |
|
|
|
|
|
| C0 (ppb) |
|
4.0 |
Cont Depth (cm) |
0 |
Outflow
GM, Q>0 (ppb) |
711.2 |
Mean Stored P (mg/m2) |
5633 |
|
|
|
|
|
| C2 (ppb) |
|
0 |
Qout Intercept |
0.3 |
Seepage Loss |
|
0% |
Storage Inc/Net
Removal |
0% |
|
|
|
|
|
| Zx (cm) |
|
40 |
Qout Exponent |
1.5 |
HRT (days) |
|
56.0 |
Outfl. Seepage
(cm/d/cm) |
0 |
|
|
|
|
|
| |
|
|
|
|
|
|
|
|
|
|
|
|
|
|
|
| Ki |
E/m2-d |
0 |
0 |
Model 2 |
Mean Biomass (g/m2) |
#N/A |
Biomass Turnover (1/yr) |
#N/A |
|
|
|
|
|
| Kb |
1/d |
0 |
0 |
" |
Gross PP
(g/m2-d) |
#N/A |
Total Resp (g/m2-d) |
#N/A |
|
|
|
|
|
| Kr |
1/d/g/m2 |
0 |
0 |
" |
|
|
|
|
|
|
|
|
|
|
|
| Ka |
1/d |
0 |
0 |
" |
|
|
|
|
|
|
|
|
|
|
|
| Kc |
ppb |
0 |
0 |
" |
|
|
|
|
|
|
|
|
|
|
|
| Ke |
1/d |
0 |
0 |
" |
|
|
|
|
|
|
|
|
|
|
|
| Ku |
mg/m2 |
0 |
0 |
" |
|
|
|
|
|
|
|
|
|
|
|
| |
|
|
|
|
|
|
|
|
|
|
|
|
|
|
|
| Calibration Statistics for Period: |
|
10/01/81 |
thru |
09/30/91 |
|
|
|
|
|
|
|
|
|
|
| |
|
|
|
|
|
Mean |
Mean |
|
|
|
|
|
|
|
|
| Inflow P Conc
(ppb) = |
1108 |
Count |
Observed |
Predicted |
Residual |
Resid% |
RSE% |
R2 |
|
|
|
|
|
|
| Mean Depth (cm) |
|
121 |
156.3 |
153.6 |
2.7 |
2% |
4% |
90% |
|
|
|
|
|
|
| Flow (cm/day) |
|
|
121 |
2.74 |
2.88 |
-0.14 |
-5% |
15% |
98% |
|
|
|
|
|
|
| Flow-Wtd-Mean
Conc (ppb) |
|
121 |
768.5 |
760.4 |
8.2 |
1% |
|
|
|
|
|
|
|
|
| Geometric Mean Conc (ppb) |
|
121 |
725.4 |
733.3 |
-7.9 |
-1% |
29% |
40% |
|
|
|
|
|
|
| Mean Conc (ppb) |
|
121 |
776.7 |
765.8 |
10.9 |
1% |
28% |
46% |
|
|
|
|
|
|
| Outflow Load (mg/m2-d) |
|
121 |
21.02 |
21.89 |
-0.87 |
-4% |
31% |
94% |
|
|
|
|
|
|
| Pred Q x Conc
(mg/m2-d) |
|
121 |
22.12 |
21.89 |
0.24 |
1% |
25% |
96% |
|
|
|
|
|
|
| Conc Reduction (%) |
|
121 |
31% |
31% |
-0.01 |
-1% |
|
|
|
|
|
|
|
|
|
|
|
|
|
|
|
|
|
|
|
|
|
|
|
|
| |
|
|
|
|
|
|
|
|
|
|
|
|
|
|
|
| |
|
|
|
|
|
|
|
|
|
|
|
|
|
|
|
| |
|
|
|
|
|
|
|
|
|
|
|
|
|
|
|
| |
|
|
|
|
|
|
|
|
|
|
|
|
|
|
|
| |
|
|
|
|
|
|
|
|
|
|
|
|
|
|
|
| |
|
|
|
|
|
|
|
|
|
|
|
|
|
|
|
| |
|
|
|
|
|
|
|
|
|
|
|
|
|
|
|
| |
|
|
|
|
|
|
|
|
|
|
|
|
|
|
|
| |
|
|
|
|
|
|
|
|
|
|
|
|
|
|
|
| |
|
|
|
|
|
|
|
|
|
|
|
|
|
|
|
| |
|
|
|
|
|
|
|
|
|
|
|
|
|
|
|
| |
|
|
|
|
|
|
|
|
|
|
|
|
|
|
|
| |
|
|
|
|
|
|
|
|
|
|
|
|
|
|
|
| |
|
|
|
|
|
|
|
|
|
|
|
|
|
|
|
| |
|
|
|
|
|
|
|
|
|
|
|
|
|
|
|
| |
|
|
|
|
|
|
|
|
|
|
|
|
|
|
|
| |
|
|
|
|
|
|
|
|
|
|
|
|
|
|
|
| |
|
|
|
|
|
|
|
|
|
|
|
|
|
|
|
| |
|
|
|
|
|
|
|
|
|
|
|
|
|
|
|
| |
|
|
|
|
|
|
|
|
|
|
|
|
|
|
|
| |
|
|
|
|
|
|
|
|
|
|
|
|
|
|
|
|
|
|
|
|
|
|
|
|
|
|
|
|
|
|
|
|
| |
|
|
|
|
|
|
|
|
|
|
|
|
|
|
|
| |
|
|
|
|
|
|
|
|
|
|
|
|
|
|
|
| |
|
|
|
|
|
|
|
|
|
|
|
|
|
|
|
| |
|
|
|
|
|
|
|
|
|
|
|
|
|
|
|
| |
|
|
|
|
|
|
|
|
|
|
|
|
|
|
|
| |
|
|
|
|
|
|
|
|
|
|
|
|
|
|
|
| |
|
|
|
|
|
|
|
|
|
|
|
|
|
|
|
| |
|
|
|
|
|
|
|
|
|
|
|
|
|
|
|
| |
|
|
|
|
|
|
|
|
|
|
|
|
|
|
|
| |
|
|
|
|
|
|
|
|
|
|
|
|
|
|
|
| |
|
|
|
|
|
|
|
|
|
|
|
|
|
|
|
| |
|
|
|
|
|
|
|
|
|
|
|
|
|
|
|
| |
|
|
|
|
|
|
|
|
|
|
|
|
|
|
|
| |
|
|
|
|
|
|
|
|
|
|
|
|
|
|
|
| |
|
|
|
|
|
|
|
|
|
|
|
|
|
|
|
| |
|
|
|
|
|
|
|
|
|
|
|
|
|
|
|
| |
|
|
|
|
|
|
|
|
|
|
|
|
|
|
|
| |
|
|
|
|
|
|
|
|
|
|
|
|
|
|
|
| |
|
|
|
|
|
|
|
|
|
|
|
|
|
|
|
| |
|
|
|
|
|
|
|
|
|
|
|
|
|
|
|
| |
|
|
|
|
|
|
|
|
|
|
|
|
|
|
|
| |
|
|
|
|
|
|
|
|
|
|
|
|
|
|
|
| |
|
|
|
|
|
|
|
|
|
|
|
|
|
|
|
| |
|
|
|
|
|
|
|
|
|
|
|
|
|
|
|
| |
|
|
|
|
|
|
|
|
|
|
|
|
|
|
|
| |
|
|
|
|
|
|
|
|
|
|
|
|
|
|
|
| |
|
|
|
|
|
|
|
|
|
|
|
|
|
|
|
| |
|
|
|
|
|
|
|
|
|
|
|
|
|
|
|
| |
|
|
|
|
|
|
|
|
|
|
|
|
|
|
|
| |
|
|
|
|
|
|
|
|
|
|
|
|
|
|
|
| |
|
|
|
|
|
|
|
|
|
|
|
|
|
|
|
| |
|
|
|
|
|
|
|
|
|
|
|
|
|
|
|
| |
|
|
|
|
|
|
|
|
|
|
|
|
|
|
|
| |
|
|
|
|
|
|
|
|
|
|
|
|
|
|
|
| |
|
|
|
|
|
|
|
|
|
|
|
|
|
|
|
| |
|
|
|
|
|
|
|
|
|
|
|
|
|
|
|
| |
|
|
|
|
|
|
|
|
|
|
|
|
|
|
|
| |
|
|
|
|
|
|
|
|
|
|
|
|
|
|
|
| |
|
|
|
|
|
|
|
|
|
|
|
|
|
|
|
| |
|
|
|
|
|
|
|
|
|
|
|
|
|
|
|
| |
|
|
|
|
|
|
|
|
|
|
|
|
|
|
|
| |
|
|
|
|
|
|
|
|
|
|
|
|
|
|
|
| |
|
|
|
|
|
|
|
|
|
|
|
|
|
|
|
| |
|
|
|
|
|
|
|
|
|
|
|
|
|
|
|
| |
|
|
|
|
|
|
|
|
|
|
|
|
|
|
|
| Obs Load2 = Predicted
Flow x Observed Conc |
|
|
|
|
|
|
|
|
|
|
|
|
| Green
lines on x axis of concentration plots indicate model calibration
period. Statistics at top of sheet are
for entire output period. |
|
|
|
|
|
|
| 03/02/05 |
|
|
|
|
|
|
|
|
|
|
|
|
|
|
|
|
|
|
|
|
|
|
|
|
|
|
|
|
|
|
|


