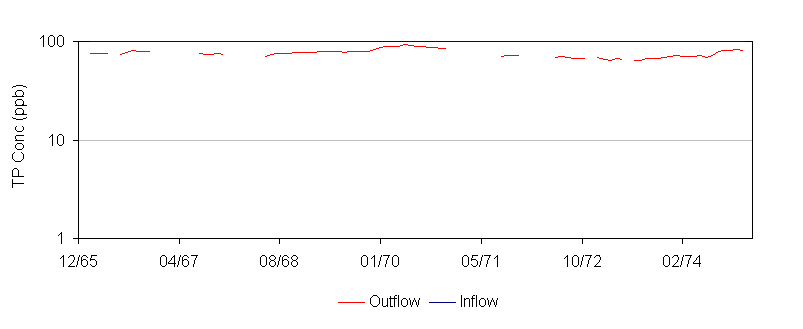
| Reservoir Performance Analysis |
|
|
|
|
|
5/31/2005 |
|
| Project: PROJECT_EXAMPLES Series:
TS_RES Case: RSTA_1 , Cell =
RES |
|
|
|
|
|
|
|
|
|
|
|
|
Flow |
Load |
Conc |
|
| Variable |
|
|
Units |
Value |
|
Water & P Budget |
|
hm3/yr |
kg/yr |
ppb |
|
| Minimum Depth
for Release |
cm |
10 |
|
Total Inflow |
|
1187.79 |
118779 |
100 |
|
| Bypass Depth |
|
cm |
10 |
|
Bypass |
|
0.00 |
0 |
|
|
| Outflow Control Depth |
|
cm |
10 |
|
Cell Inflow |
|
1187.79 |
118779 |
100 |
|
| Outlet Weir Depth |
|
cm |
10 |
|
Cell Outflow |
|
665.88 |
53172 |
80 |
|
| Mean Depth |
|
cm |
208 |
|
Release 1 |
|
512.74 |
39840 |
78 |
|
| Minimum Depth |
|
cm |
5 |
|
Release 2 |
|
0.00 |
0 |
|
|
| Max Depth |
|
|
cm |
347 |
|
Outflow+Release |
1178.63 |
93012 |
79 |
|
| 10th Percentile |
|
cm |
92 |
|
Reduction |
|
9.17 |
25767 |
21 |
|
| 50th Percentile |
|
cm |
217 |
|
|
|
|
|
|
|
| 90th
Percentile |
|
cm |
294 |
|
Percent Reduction |
|
1% |
22% |
21% |
|
| Freq Depth
< 10 cm |
|
% |
1% |
|
|
|
|
|
|
|
| Max Outflow |
|
hm3/d |
10.87 |
|
|
|
|
|
|
|
| 90th Percentile |
|
hm3/d |
5.58 |
|
|
|
|
|
|
|
| Max Outflow
Conc |
|
ppb |
92.4 |
|
|
|
|
|
| 90th
Percentile |
|
ppb |
86.6 |
|
|
|
|
|
|
|
|
|
|
|
|
|
| Simulated vs.
Specified Releases & Outflow |
|
|
|
|
|
|
|
|
|
|
Simulated Flow
(hm3/yr) |
|
| Term |
|
|
Specified |
Value |
Mean |
Dif |
% Dif |
Ratio |
| Release 1 |
|
|
WSUPPLY |
512.8 |
512.7 |
0.0 |
0% |
100% |
| Release 2 |
|
|
|
#N/A |
0.0 |
#N/A |
#N/A |
#N/A |
| Outflow |
|
|
|
#N/A |
665.9 |
#N/A |
#N/A |
#N/A |
|
|
|
|
|
|
|
|
|
| Mean'Depth (cm) |
|
|
#N/A |
208 |
#N/A |
#N/A |
#N/A |
|
|
|
|
|
|
|
|
|
|
|
|
|
|
|
| Comparison of
Simulated vs. Specified Depths, Outflows, &
Releases |
|
|
|
|
|
|
|
|
|
| Blue Lines =
simulated values |
|
|
|
|
|
|
|
|
|
| Red
symbols = values specified in input file used as
constraint |
|
|
|
|
|
|
|
|
|
| Green
symbols = values specified in input file but not used as constraint,
identified with * above. |
|
|
|
|
|
|
|
|
|
|
|
|
|
|
|
    
|
|
|
|
|
|
|
|
|
|
|
|
|
|
|
|
|
|
|
|
|
|
|
|
|
|
|
|
|
|
|
|
|
|
|
|
|
|
|
|
|
|
|
|
|
|
|
|
|
|
|
|
|
|
|
|
|
|
|
|
|
|
|
|
|
|
|
|
|
|
|
|
|
|
|
|
|
|
|
|
|
|
|
|
|
|
|
|
|
|
|
|
|
|
|
|
|
|
|
|
|
|
|
|
|
|
|
|
|
|
|
|
|
|
|
|
|
|
|
|
|
|
|
|
|
|
|
|
|
|
|
|
|
|
|
|
|
|
|
|
|
|
|
|
|
|
|
|
|
|
|
|
|
|
|
|
|
|
|
|
|
|
|
|
|
|
|
|
|
|
|
|
|
|
|
|
|
|
|
|
|
|
|
|
|
|
|
|
|
|
|
|
|
|
|
|
|
|
|
|
|
|
|
|
|
|
|
|
|
|
|
|
|
|
|
|
|
|
|
|
|
|
|
|
|
|
|
|
|
|
|
|
|
|
|
|
|
|
|
|
|
|
|
|
|
|
|
|
|
|
|
|
|
|
|
|
|
|
|
|
|
|
|
|
|
|
|
|
|
|
|
|
|
|
|
|
|
|
|
|
|
|
|
|
|
|
|
|
|
|
|
|
|
|
|
|
|
|
|
|
|
|
|
|
|
|
|
|
|
|
|
|
|
|
|
|
|
|
|
|
|
|
|
|
|
|
|
|
|
|
|
|
|
|
|
|
|
|
|
|
|
|
|
|
|
|
|
|
|
|
|
|
|
|
|
|
|
|
|
|
|
|
|
|
|
|
|
|
|
|
|
|
|
|
|
|
|
|
|
|
|
|
|
|
|
|
|
|
|
|
|
|
|
|
|
|
|
|
|
|
|
|
|
|
|
|
|
|
|
|
|
|
|
|
|
|
|
|
|
|
|
|
|
|
|
|
|
|
|
|
|
|
|
|
|
|
|
|
|
|
|
|
|
|
|
|
|
|
|
|
|
|
|
|
|
|
|
|
|
|
|
|
|
|
|
|
|
|
|
|
|
|
|
|
|
|
|
|
|
|
|
|
|
|
|
|
|
|
|
|
|
|
|
|
|
|
|
|
|
|
|
|
|
|
|
|
|
|
|
|
|
|
|
|
|
|
|
|
|
|
|
|
|
|
|
|
|
|
|
|
|
|
|
|
|
|
|
|
|
|
|
|
|
|
|
|
|
|
|
|
|
|
|
|
|
|
|
|
|
|
|
|
|
|
|
|
|
|
|
|
|
|
|
|
|
|
|
|
|
|
|
|
|
|
|
|
|
|
|
|
|
|
|
|
|
|
|
|
|
|
|
|
|
|
|
|
|
|
|
|
|
|
|
|
|
|
|
|
|
|
|
|
|
|
|
|
|
|
|
|
|
|
|
|
|
|
|
|
|
|
|
|
|
|
|
|
|
|
|
|
|
|
|
|
|
|
|
|
|
|
|
|
|
|
|
|
|
|
|
|
|
|
|
|
|
|
|
|
|
|
|
|
|
|
|
|
|
|
|
|
|
|
|
|
|
|
|
|
|
|
|
|
|
|
|
|
|
|
|
|
|
|
|
|
|
|
|
|
|
|
|
|
|
|
|
|
|
|
|
|
|
|
|
|
|
|
|
|
|
|
|
|
|
|
|
|
|
|
|
|
|
|
|
|
|
|
|
|
|
|
|
|
|
|
|
|
|
|
|
|
|
|
|
|
|
|
|
|
|
|
|
|
|
|
|
|
|
|
|
|
|
|
|
|
|
|
|
|
|
|
|
|
|
|
|
|
|
|
|
|
|
|
|
|
|
|
|
|
|
|
|
|
|
|
|
|
|
|
|
|
|
|
|
|
|
|
|
|
|
|
|
|
|
|
|
|
|
|
|
|
|
|
|
|
|
|
|
|
|
|
|
|
|
|
|
|
|
|
|
|
|
|
|
|
|
|
|
|
|
|
|
|
|
|
|
|
|
|
|
|
|
|
|
|
|
|
|
|
|
|
|
|
|
|
|
|
|
|
|
|
|
|
|
|
|
|
|
|
|
|
|
|
|
|
|
|
|
|
|
|
|
|
|
|
|
|
|
|
|
|
|
|
|
|
|
|
|
|
|
|
|
|
|
|
|
|
|
|
|
|
|
|
|
|
|
|
|
|
|
|
|
|


