| Frequency
Distributions |
Project: PROJECT_EXAMPLES Series:
TS_RES Case: RSTA_1 |
|
|
|
| |
|
|
|
Dates:
01/01/66 thru 12/31/74 |
|
|
|
|
|
|
|
| Overall |
|
|
|
|
|
|
|
|
|
|
|
|
|
|
|
|
|
|
|
|
|
|
|
|
|
|
|
|
|
|
|
|
|
|
|
|
|
|
|
|
|
|
|
|
|
|
|
|
|
|
|
|
|
|
|
|
|
|
|
|
|
|
|
|
|
|
|
|
|
|
|
|
|
|
|
|
|
|
|
|
|
|
|
|
|
|
|
|
|
|
|
|
|
|
|
|
|
|
|
|
|
|
|
|
|
|
|
|
|
|
|
|
|
|
|
|
|
|
|
|
|
|
|
|
|
|
|
|
|
|
|
|
|
|
|
|
|
|
|
|
|
|
|
|
|
|
|
|
|
|
|
|
|
|
|
|
|
|
|
|
|
|
|
|
|
|
|
|
|
|
|
|
|
|
|
|
|
|
|
|
|
|
|
|
|
|
|
|
|
|
|
|
|
|
|
|
|
|
|
|
|
|
|
|
|
|
|
|
|
|
|
|
|
|
|
|
|
|
|
|
|
|
|
|
|
|
|
|
|
|
|
|
|
|
|
|
|
|
|
|
|
|
|
|
|
|
|
|
|
|
|
|
|
|
|
|
|
|
|
|
|
|
|
|
|
|
|
|
|
|
|
|
|
|
|
|
|
|
|
|
|
|
|
|
|
|
|
|
|
|
|
|
|
|
|
|
|
|
|
|
|
|
|
|
|
|
|
|
|
|
|
|
|
|
|
| Averaging Period |
|
30 |
days |
Flow-Wtd Mean |
|
22.2 |
ppb |
|
|
|
|
|
| Daily
Geometric Mean |
#N/A |
ppb |
FW Mean - With
Bypass |
22.2 |
ppb |
|
|
|
|
|
| Geo Mean of
30-Day FW Means |
14.2 |
ppb |
Coef of Variation |
|
0.33 |
|
|
|
|
|
|
|
|
|
|
|
|
|
|
|
|
|
|
|
|
|
|
|
|
|
|
|
|
|
|
|
|
|
|
|
|
|
Total Inflow
(Term 2) |
ByPass
(Term 3) |
Outflow (Excl.
Bypass & Releases, Term 13) |
|
|
|
|
Flow |
Conc |
Load |
Flow |
Conc |
Load |
Flow |
HLR |
Conc |
Load |
|
|
|
|
| Cum % |
hm3/d |
ppb |
kg/d |
hm3/d |
ppb |
kg/d |
hm3/d |
cm/d |
ppb |
kg/d |
|
|
|
|
| 0% |
0.00 |
100.0 |
0.0 |
0.00 |
|
0.00 |
0.00 |
0.0 |
7.2 |
0.0 |
|
|
|
|
| 1% |
0.05 |
100.0 |
4.7 |
0.00 |
|
0.00 |
0.00 |
0.0 |
8.0 |
0.0 |
|
|
|
|
| 5% |
0.17 |
100.0 |
16.8 |
0.00 |
|
0.00 |
0.00 |
0.0 |
8.4 |
0.0 |
|
|
|
|
| 10% |
0.41 |
100.0 |
40.8 |
0.00 |
|
0.00 |
0.00 |
0.0 |
8.8 |
0.0 |
|
|
|
|
| 20% |
1.10 |
100.0 |
110.3 |
0.00 |
|
0.00 |
0.00 |
0.0 |
9.6 |
0.0 |
|
|
|
|
| 25% |
1.39 |
100.0 |
139.4 |
0.00 |
|
0.00 |
0.00 |
0.0 |
10.0 |
0.0 |
|
|
|
|
| 40% |
2.44 |
100.0 |
243.8 |
0.00 |
|
0.00 |
0.14 |
0.1 |
11.7 |
1.3 |
|
|
|
|
| 50% |
2.96 |
100.0 |
295.8 |
0.00 |
|
0.00 |
0.52 |
0.3 |
13.0 |
5.2 |
|
|
|
|
| 60% |
3.40 |
100.0 |
340.2 |
0.00 |
|
0.00 |
1.08 |
0.6 |
14.6 |
13.4 |
|
|
|
|
| 75% |
4.06 |
100.0 |
405.9 |
0.00 |
|
0.00 |
2.80 |
1.4 |
17.5 |
44.1 |
|
|
|
|
| 80% |
4.39 |
100.0 |
439.0 |
0.00 |
|
0.00 |
3.29 |
1.7 |
22.5 |
51.7 |
|
|
|
|
| 90% |
6.44 |
100.0 |
643.8 |
0.00 |
|
0.00 |
6.08 |
3.1 |
28.5 |
146.0 |
|
|
|
|
| 95% |
9.26 |
100.0 |
925.8 |
0.00 |
|
0.00 |
8.05 |
4.1 |
30.4 |
233.8 |
|
|
|
|
| 99% |
9.98 |
100.0 |
997.8 |
0.00 |
|
0.00 |
10.27 |
5.2 |
34.4 |
297.2 |
|
|
|
|
| 100% |
14.20 |
100.0 |
1420.3 |
0.00 |
|
0.00 |
10.41 |
5.3 |
36.4 |
379.0 |
|
|
|
|
|
|
|
|
|
|
|
|
|
|
|
|
|
|
|
| Mean |
3.26 |
100.0 |
326.1 |
0.00 |
#N/A |
0.00 |
1.81 |
0.9 |
22.2 |
40.1 |
|
|
|
|
|
|
|
|
|
|
|
|
|
|
|
|
|
|
|
|
|
|
|
|
|
|
|
|
|
|
|
|
|
|
| Frequency
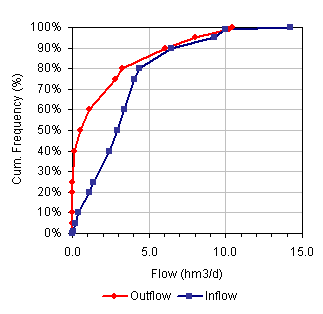
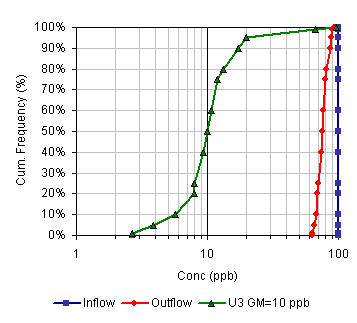
Distributions for Selected Cell: |
Cell 1 : RES |
|
|
|
|
|
|
|
|
|
|
|
|
|
|
|
|
|
|
|
Select Cell: |
|
|
|
|
|
|
|
|
|
|
|
|
|
|
|
|
|
|
|
|
|
|
|
|
|
|
|
|
|
|
|
|
|
|
|
|
|
|
|
|
|
|
|
|
|
|
|
|
|
|
|
|
|
|
|
|
|
|
|
|
|
|
|
|
|
|
|
|
|
|
|
|
|
|
|
|
|
|
|
|
|
|
|
|
|
|
|
|
|
|
|
|
|
|
|
|
|
|
|
|
|
|
|
|
|
|
|
|
|
|
|
|
|
|
|
|
|
|
|
|
|
|
|
|
|
|
|
|
|
|
|
|
|
|
|
|
|
|
|
|
|
|
|
|
|
|
|
|
|
|
|
|
|
|
|
|
|
|
|
|
|
|
|
|
|
|
|
|
|
|
|
Not Flow Wtd |
|
|
|
Total Inflow
(Term 2) |
ByPass (Term 3) |
Outflow (Excl. Bypass & Seepage, Term
13) |
GeoMean |
U3* |
|
|
Flow |
Conc |
Load |
Flow |
Conc |
Load |
Flow |
HLR |
Conc |
Load |
Depth |
Conc |
Conc |
|
| Cum % |
hm3/d |
ppb |
kg/d |
hm3/d |
ppb |
kg/d |
hm3/d |
cm/d |
ppb |
kg/d |
cm |
ppb |
ppb |
|
| 0% |
0.00 |
100.0 |
0.02 |
0.00 |
|
0.00 |
0.00 |
0.0 |
63.4 |
0.00 |
5 |
63.0 |
2.7 |
|
| 1% |
0.05 |
100.0 |
4.72 |
0.00 |
|
0.00 |
0.00 |
0.0 |
63.5 |
0.00 |
22 |
63.3 |
2.7 |
|
| 5% |
0.17 |
100.0 |
16.78 |
0.00 |
|
0.00 |
0.00 |
0.0 |
65.8 |
0.00 |
54 |
65.4 |
3.9 |
|
| 10% |
0.41 |
100.0 |
40.76 |
0.00 |
|
0.00 |
0.00 |
0.0 |
67.4 |
0.00 |
92 |
66.3 |
5.7 |
|
| 20% |
1.10 |
100.0 |
110.25 |
0.00 |
|
0.00 |
0.00 |
0.0 |
69.4 |
0.00 |
155 |
68.3 |
8.0 |
|
| 25% |
1.39 |
100.0 |
139.36 |
0.00 |
|
0.00 |
0.00 |
0.0 |
70.7 |
0.00 |
180 |
69.3 |
8.0 |
|
| 40% |
2.44 |
100.0 |
243.83 |
0.00 |
|
0.00 |
0.28 |
0.2 |
73.9 |
19.73 |
207 |
72.4 |
9.3 |
|
| 50% |
2.96 |
100.0 |
295.85 |
0.00 |
|
0.00 |
0.56 |
0.5 |
75.5 |
42.11 |
217 |
75.2 |
10.0 |
|
| 60% |
3.40 |
100.0 |
340.21 |
0.00 |
|
0.00 |
1.02 |
0.8 |
77.1 |
78.28 |
230 |
77.1 |
10.7 |
|
| 75% |
4.06 |
100.0 |
405.87 |
0.00 |
|
0.00 |
2.76 |
2.3 |
79.7 |
207.64 |
259 |
79.3 |
12.0 |
|
| 80% |
4.39 |
100.0 |
438.97 |
0.00 |
|
0.00 |
3.04 |
2.5 |
81.3 |
238.21 |
262 |
80.2 |
13.3 |
|
| 90% |
6.44 |
100.0 |
643.83 |
0.00 |
|
0.00 |
5.58 |
4.6 |
86.6 |
502.28 |
294 |
86.6 |
17.3 |
|
| 95% |
9.26 |
100.0 |
925.76 |
0.00 |
|
0.00 |
8.45 |
7.0 |
89.0 |
666.81 |
326 |
89.8 |
20.0 |
|
| 99% |
9.98 |
100.0 |
997.77 |
0.00 |
|
0.00 |
10.23 |
8.5 |
90.7 |
858.03 |
343 |
135.2 |
66.8 |
|
| 100% |
14.20 |
100.0 |
1420.30 |
0.00 |
|
0.00 |
10.87 |
9.0 |
92.4 |
932.04 |
347 |
328.9 |
97.2 |
|
|
|
|
|
|
|
|
|
|
|
|
|
|
|
|
| Mean |
3.26 |
100.0 |
326.09 |
0.00 |
#N/A |
0.00 |
1.83 |
1.5 |
79.9 |
146.15 |
208 |
76.2 |
10.0 |
|
|
|
|
|
|
|
|
|
|
|
|
|
|
|
|
| *
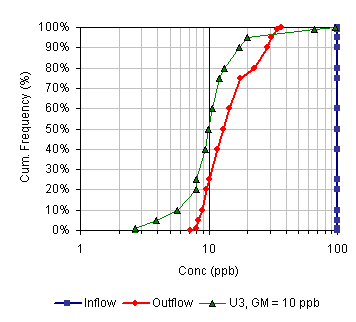
Frequency distribution at Site U3,
unimpacted region of WCA-2A, 1994-2004, rescaled to long-term geomean
= 10 ppb |
|
|
|
|
|
|
|
|
|
|
|
|
|
|
|
|
|
|
|
|
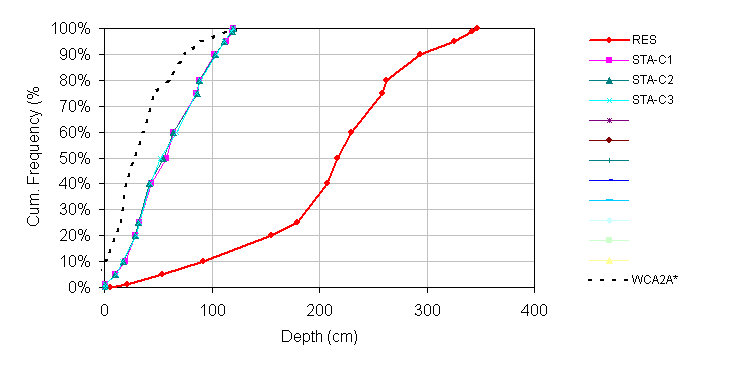
| Cumulative
Frequency Distribution of Cell Water Depths |
|
|
|
|
|
|
|
|
|
|
|
|
|
|
|
|
|
|
|
|
|
|
|
|
|
|
|
|
|
|
|
|
|
|
|
|
|
|
|
|
|
|
|
|
|
|
|
|
|
|
|
|
|
|
|
|
|
|
|
|
|
|
|
|
|
|
|
|
|
|
|
|
|
|
|
|
|
|
|
|
|
|
|
|
|
|
|
|
|
|
|
|
|
|
|
|
|
|
|
|
|
|
|
|
|
|
|
|
|
|
|
|
|
|
|
|
|
|
|
|
|
|
|
|
|
|
|
|
|
|
|
|
|
|
|
|
|
|
|
|
|
|
|
|
|
|
|
|
|
|
|
|
|
|
|
|
|
|
|
|
|
|
|
|
|
|
|
|
|
|
|
|
|
|
|
|
|
|
|
|
|
|
|
|
|
|
|
|
|
|
|
|
|
|
|
|
|
|
|
|
|
|
|
|
|
|
|
|
|
|
|
|
|
|
|
|
|
|
|
|
|
|
|
|
|
|
|
|
|
|
|
|
|
|
|
|
|
|
|
|
|
|
|
|
|
|
|
|
|
|
|
|
|
|
|
|
|
|
|
|
|
|
|
|
|
|
|
|
|
|
|
|
|
|
|
|
|
|
|
|
|
|
|
|
|
|
|
|
|
|
|
|
|
|
|
|
|
|
|
|
|
|
|
|
|
|
|
|
|
|
|
|
|
|
|
|
|
|
|
|
|
|
|
|
|
|
|
|
|
|
|
|
|
|
|
|
|
|
|
|
|
|
|
|
|
|
|
|
|
ECP STA |
|
|
|
|
|
|
|
|
|
|
|
|
|
|
Design |
|
| Cell |
1 |
2 |
3 |
4 |
5 |
6 |
7 |
8 |
9 |
10 |
11 |
12 |
WCA2A* |
|
| Cum
% |
RES |
STA-C1 |
STA-C2 |
STA-C3 |
|
|
|
|
|
|
|
|
|
|
| 0% |
5 |
1 |
1 |
1 |
|
|
|
|
|
|
|
|
-54 |
|
| 1% |
22 |
1 |
1 |
1 |
|
|
|
|
|
|
|
|
-28 |
|
| 5% |
54 |
10 |
11 |
11 |
|
|
|
|
|
|
|
|
-7 |
|
| 10% |
92 |
20 |
17 |
17 |
|
|
|
|
|
|
|
|
2 |
|
| 20% |
155 |
29 |
29 |
30 |
|
|
|
|
|
|
|
|
10 |
|
| 25% |
180 |
33 |
31 |
32 |
|
|
|
|
|
|
|
|
16 |
|
| 40% |
207 |
44 |
42 |
43 |
|
|
|
|
|
|
|
|
21 |
|
| 50% |
217 |
58 |
55 |
52 |
|
|
|
|
|
|
|
|
28 |
|
| 60% |
230 |
65 |
64 |
67 |
|
|
|
|
|
|
|
|
36 |
|
| 75% |
259 |
85 |
86 |
85 |
|
|
|
|
|
|
|
|
46 |
|
| 80% |
262 |
88 |
88 |
89 |
|
|
|
|
|
|
|
|
60 |
|
| 90% |
294 |
102 |
103 |
104 |
|
|
|
|
|
|
|
|
75 |
|
| 95% |
326 |
113 |
112 |
112 |
|
|
|
|
|
|
|
|
91 |
|
| 99% |
343 |
119 |
119 |
118 |
|
|
|
|
|
|
|
|
114 |
|
| 100% |
347 |
120 |
120 |
120 |
|
|
|
|
|
|
|
|
130 |
|
|
|
|
|
|
|
|
|
|
|
|
|
|
|
|
| *
Frequency Distribution for WCA2A Marsh, 1978-2004;
assumed as basis for ECP STA design; not necessarily optimal for treatment. |
|
|
|
|
|
|
|
|
|
|
|
|
|
|
| 5/31/2005 |
|
|
|
|
|
|
|
|
|
|
|
|
|
|
|
|
|
|
|
|
|
|
|
|
|
|
|
|
|


